 Vanitiro Editorial Team
The most important number in an Africa natural resources map may not be a reserve estimate. It may be roughly 70%. That is the share of global cobalt production attributed in recent years to the Democratic Republic of the Congo, according to the Africa Major Mineral Deposits Web Map. Once one country occupies that kind of position in a strategic supply chain, a map stops being a classroom graphic and becomes a geopolitical instrument.
That shift in perspective matters. A serious Africa natural resources map isn't just about locating ore bodies, oil basins, or river systems. It helps analysts test harder questions. Which deposits can reach ports. Which states can move from extraction to processing. Which water basins are becoming security issues. Which transport corridors create influence for governments, armed groups, or outside powers.
For policymakers, investors, and security planners, the value of the map lies in interpretation. Geography tells you where resources are. Strategy begins when you layer in infrastructure, political authority, conflict exposure, and export dependence.
Table of Contents
- Why Resource Maps Are Central to African Geopolitics
- Decoding a Modern Africa Natural Resources Map
- Authoritative Maps for Key African Resources
- From Geography to Geopolitics
- Case Studies in Resource Strategy
- Interactive Tools for Further Analysis
- Strategic Outlook for Africa's Resource Landscape
Why Resource Maps Are Central to African Geopolitics
Resource politics in Africa is often described as a story of abundance. That framing is too shallow to be useful. Abundance without transport, grid access, processing plants, regulatory capacity, and territorial control doesn't automatically produce power.
A better reading starts with concentration. When a critical mineral is heavily concentrated in one jurisdiction, governments, manufacturers, and militaries all start asking the same question. Not how much exists in theory, but how secure the chain is from mine to refinery to export terminal.
That is why an Africa natural resources map belongs in the same analytical file as maritime chokepoints, insurgent activity, and industrial policy. It helps explain where states can bargain for better terms, where outside powers will compete for influence, and where internal instability can spill into global markets.
A resource map becomes strategic when it stops answering “what is there?” and starts answering “who can use it, move it, protect it, and tax it?”
Three implications follow.
- Supply chains are territorial: Mineral dependence isn't abstract. It is routed through specific provinces, roads, border posts, rail links, power systems, and ports.
- State strength is spatial: A government may control a capital city but still struggle to govern the zones where extraction happens.
- Security risks aren't limited to mines: Water basins, logistics corridors, and processing hubs can matter as much as the deposit itself.
Analysts who treat the map as static miss the true contest. The contest is over corridors, conversion capacity, and administrative reach. That is where trade advantage and political fragility meet.
Decoding a Modern Africa Natural Resources Map
More than one strategic mistake begins with a bad map. Analysts who read an Africa natural resources map as a static inventory can misjudge export risk, overrate state control, and miss where future competition is likely to emerge.
From deposit dots to analytical layers
A modern Africa natural resources map is a decision tool built from stacked datasets. It usually brings together physical geography, deposit records, transport corridors, water systems, administrative boundaries, and indicators of processing or power capacity. Read properly, those layers show whether a mineral occurrence can become revenue, bargaining power, or a security liability.
The distinctions inside the map matter. A known deposit is different from a proven reserve. A mining district is different from a bankable project. A prospective zone points to geological potential that may justify exploration, but it does not indicate commercially recoverable output.
As noted earlier, one of the stronger public mineral mapping references for Africa plots known deposits alongside geologic context. That combination matters because strategy depends on more than location. It depends on whether a deposit sits near rail, power, water, a port corridor, or a poorly governed border belt.
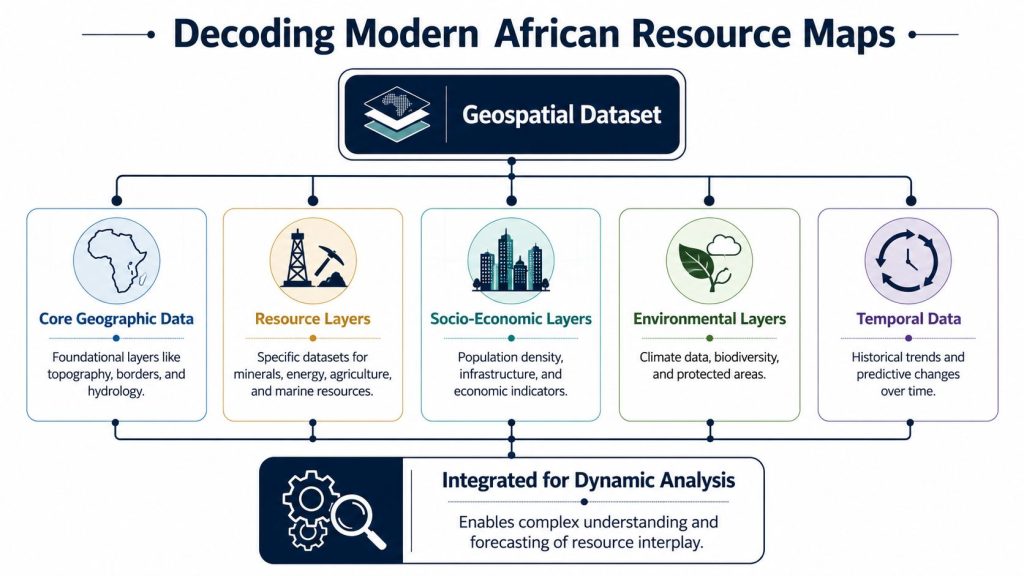
The strategic use case is clear. Global dependence on African cobalt and platinum-group metals means map interpretation belongs in industrial planning, export control analysis, and contingency planning. A deposit cluster without transmission infrastructure signals delayed supply. A mineral belt split across several jurisdictions signals future competition over standards, taxation, and transport access. A promising zone near an insurgent corridor signals a very different risk profile than an identical deposit in a well-administered district.
Why predictive mapping changes decisions
The most consequential layer is often prospectivity mapping. The point is not to display what is already being extracted. It is to identify where undiscovered resources may exist, based on geologic, geochemical, and geophysical indicators. That shifts the map from a record of existing production to an early warning tool for future licensing races, infrastructure bids, and diplomatic positioning.
| Map layer | What it tells you | Why it matters strategically |
|---|---|---|
| Known deposits | Where confirmed mineral occurrences are located | Useful for near-term supply-chain exposure |
| Geologic setting | What regional formations suggest about resource potential | Helps prioritize exploration and state planning |
| Prospectivity mapping | Where undiscovered resources may exist | Shapes long-term competition and licensing |
| Access layers | How hard it is to connect deposits to markets | Determines whether geology can become revenue |
For policy committees, three reading rules matter.
- Separate occurrence from control: A marker on a map does not show whether the state can police the site, enforce contracts, or collect rents.
- Separate potential from readiness: Mineral wealth without electricity, roads, water access, or processing capacity remains stranded or dependent on outside capital.
- Watch frontier zones closely: Prospectivity can redirect diplomatic attention long before production begins.
Practical rule: Read the map in time layers. Current production, near-term licensed projects, and geologically promising zones belong in different strategic categories.
Authoritative Maps for Key African Resources
A map that misstates deposit quality, transport access, or basin exposure can distort investment decisions and security planning for years. Public commentary on African resources still relies too often on recycled visuals with thin sourcing. Serious analysis starts with map products built by institutions that disclose methods, define categories, and support verification against other datasets.
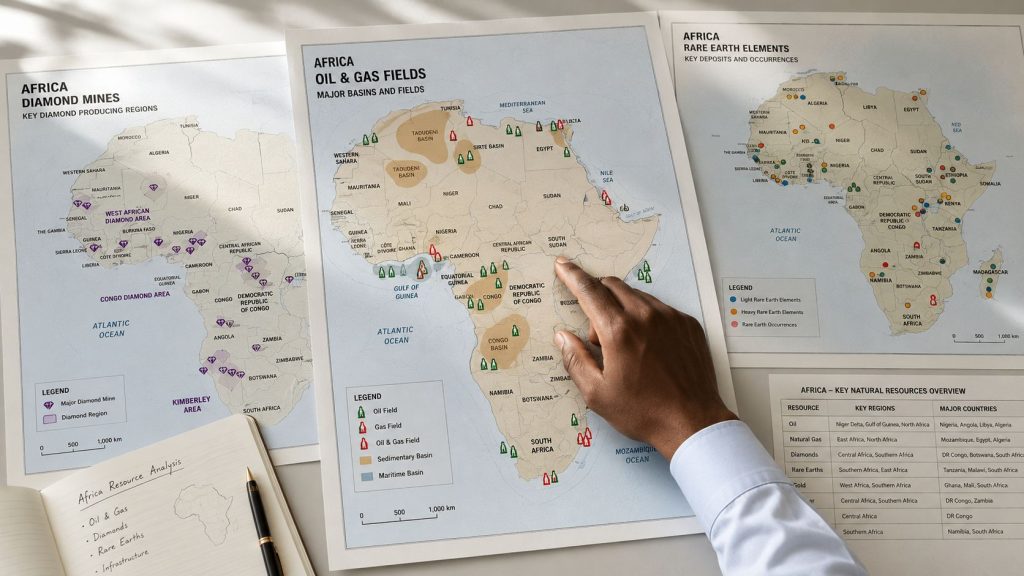
Strategic minerals
For minerals, the first test is not visual polish. It is whether the map distinguishes confirmed deposits, active extraction zones, and broader geological potential. Analysts also need enough geographic precision to compare cross-border belts, transport proximity, and state exposure to the same commodity.
That matters because mineral concentration creates strategic patterns that are easy to miss in country-by-country summaries. Copper and cobalt zones that cross borders can push governments toward shared corridor investment or regulatory rivalry. Lithium, manganese, uranium, and rare earth concentrations can expose importers to narrow supply channels and make secondary producers more valuable than their current export volumes suggest. A good mineral map therefore supports more than inventory work. It helps forecast licensing competition, infrastructure bargaining, and external diplomatic interest.
Three questions usually separate a useful mineral map from a decorative one:
- Does it show clusters rather than isolated points? Clusters reveal belts that may support rail, power, or processing investment across borders.
- Does it allow comparison across commodities? That helps identify where one state can gain influence from diversified reserves while another remains exposed to a single export.
- Does it support follow-on investigation? A deposit marker matters only if analysts can connect it to concession status, security conditions, and route access.
Infrastructure and value capture
Resource location alone does not explain who captures value. The stronger analytical approach combines extraction sites with logistics, power supply, and processing nodes. That is also the practical lesson from earlier discussion of Africa's resource potential. States with deposits but weak conversion capacity remain dependent on outside finance, foreign operators, and distant refineries.
For that reason, analysts should read four map layers together.
Extraction layer
Deposits, producing fields, and licensed projects.Movement layer
Roads, railways, pipelines, border crossings, and port access.Processing layer
Refineries, smelters, power generation, and industrial zones.Revenue layer
Customs points, export corridors, and other places where the state can collect rents.
This framework changes the policy conclusion. A remote deposit with poor electricity and no reliable export route has geological value but limited strategic weight. The same deposit can become nationally significant if a government secures a corridor, adds power, and attracts processing capacity. Rising operating costs can alter that equation quickly, especially in power-hungry sectors tied to extraction and refining. Analysts tracking those pressures should also watch the broader link between commodity projects and energy cost increases across infrastructure systems.
Water and basin geography
Water mapping belongs in the same analytical frame as minerals and hydrocarbons. In much of Africa, basin structure influences food output, hydropower reliability, urban supply, migration pressure, and cross-border bargaining at the same time.
The Sahara and Sahel make the point clearly. Basin maps in that region show where environmental stress can shift from a local resource issue into a regional political problem. Shared water systems affect pastoral movement, irrigation prospects, and settlement pressure. They also shape where armed groups can tax movement, where governments must protect infrastructure, and where neighboring states have incentives to cooperate or coerce.
The main analytical error is treating water as a separate humanitarian file. In practice, basin geography often determines whether mining, farming, and energy projects are financeable, insurable, and governable.
An authoritative Africa natural resources map is therefore not a single product. It is a disciplined set of mineral, infrastructure, and hydrological layers read together to identify where wealth can be converted into state power, and where resource abundance may instead increase fragility.
From Geography to Geopolitics
The map that matters most
The strategic map of Africa is not the one that merely shows where minerals sit underground. It is the one that reveals where those minerals can be processed, transported, insured, taxed, and exported.
That is the core lesson from the World Bank's framing discussed earlier. Resource wealth by itself doesn't create influence. Processing capacity and logistics do. A country with deposits but weak transport can remain dependent. A country that adds power, rail, port access, and refining capacity can reshape the terms of trade.
The same logic applies beyond mining. Oil and gas fields matter, but so do terminals, pipeline networks, and vulnerable offshore or delta infrastructure. Agricultural potential matters, but only if water systems, roads, and storage allow the crop to become market power. Anyone following the wider economics of energy systems will recognize the same pattern in broader discussions of rising energy costs and infrastructure constraints.
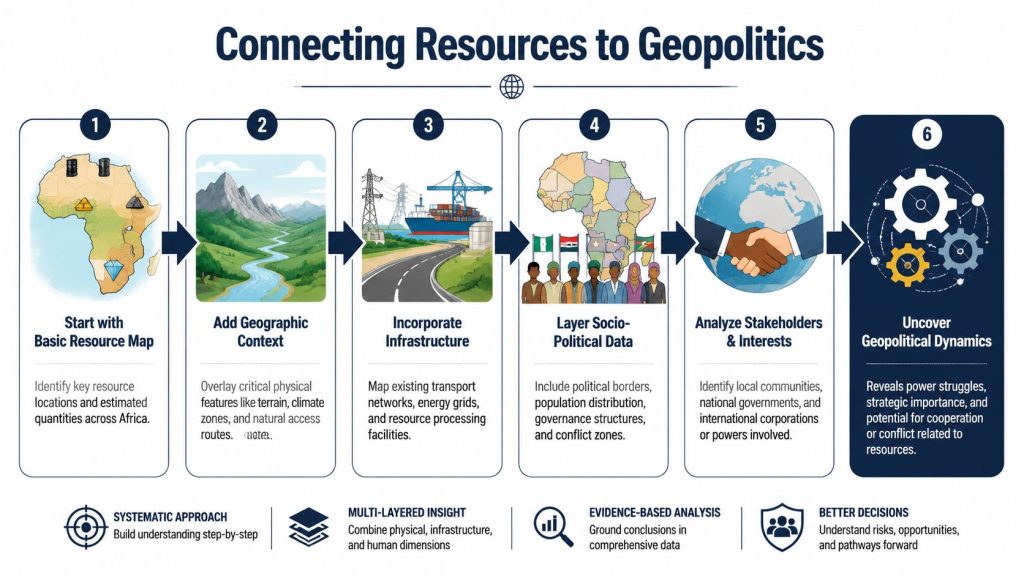
A working method for analysts
A good geopolitical read starts with overlays, not assumptions. The sequence below works in practice.
- Begin with the resource layer: Identify deposits, basins, or water systems that matter to trade or security.
- Add transport and power: Check rail, roads, ports, electricity supply, and industrial facilities.
- Overlay sovereignty and conflict: Ask who governs the corridor, not only who claims it on paper.
- Assess external interest: Look for where foreign firms, lenders, and governments have strategic exposure.
A short visual can help illustrate the method in motion.
The analytical shift is subtle but decisive. A mine in a remote district may seem like a local issue until you add a rail line to a port. A river basin may seem like an environmental issue until you add border dependence and armed group activity. A refinery may look like an industrial asset until you map its role in regional fuel security.
| If you map only | You will miss |
|---|---|
| Deposits | Whether value can be captured locally |
| Pipelines and ports | How dependence is distributed across borders |
| Conflict zones | Which export routes are most vulnerable |
| Water basins | Why ecological stress can become political leverage |
The decisive variable is often not location of extraction, but location of conversion and transit.
For committees assessing political risk, this method produces better questions. Which corridor failure would have the widest spillover. Which province matters more than its formal GDP weight suggests. Which state can negotiate harder because it controls the next bottleneck rather than the original deposit.
Case Studies in Resource Strategy
DR Congo and the cobalt problem
The Democratic Republic of the Congo sits at the center of one of the most consequential mineral geographies in the world. The issue isn't only the presence of cobalt. It is the combination of global dependence, difficult governance conditions, and the distance between extraction zones and stable industrial infrastructure.
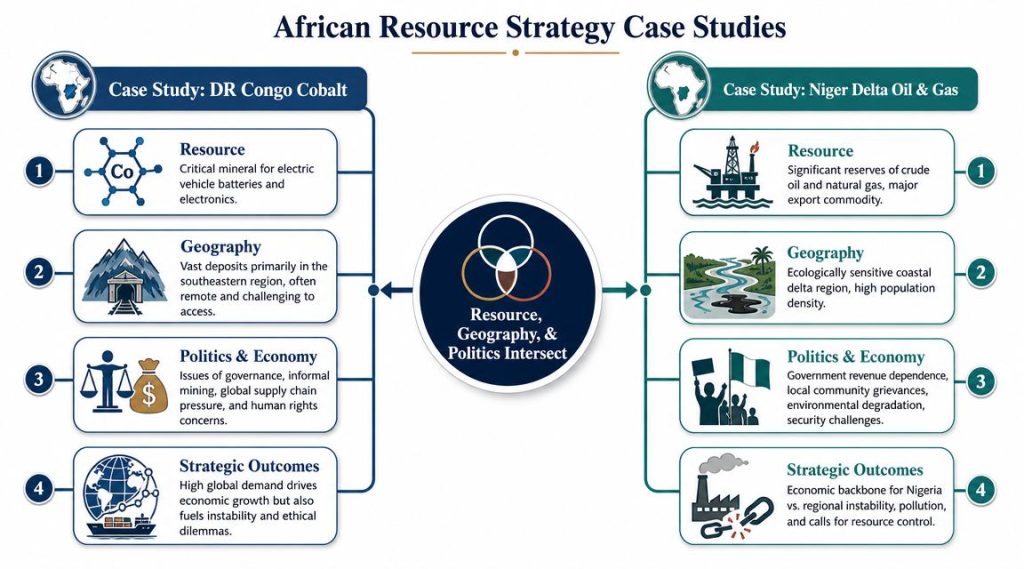
A policymaker reading the map should focus on three pressure points.
- Territorial concentration: High dependence on one producing country magnifies disruption risk.
- Corridor dependence: Export viability turns on routes, border procedures, and neighboring infrastructure.
- Governance asymmetry: International industries depend on output from zones where local enforcement may be uneven.
The strategic lesson is that mineral concentration creates influence and vulnerability at the same time. The producer state can bargain. Importing states and firms can diversify where possible. But nobody can ignore corridor security or regulatory credibility.
The Niger Delta and the politics of concentration
The Niger Delta illustrates a different pattern. Here the resource story is not frontier geology but the collision of export dependence, ecological sensitivity, and local grievance in a densely inhabited region.
An Africa natural resources map that only marks oil and gas fields would miss the main risk. The true strategic picture lies in the overlap between extraction sites, waterways, community settlement patterns, transport infrastructure, and security deployment. In that environment, damage to facilities, local protest, criminal activity, and state response all affect the same revenue stream.
Geopolitical analysis links local unrest to external consequences. If a delta region anchors a major export sector, then domestic governance failures don't stay domestic for long. They travel outward through shipping, fiscal pressure, and investor confidence. The same logic appears in other maritime theaters where attacks on transport corridors alter risk calculations far beyond the immediate battlespace, as seen in analysis of Red Sea shipping disruption and Houthi attacks.
Lake Chad and water as a strategic asset
Water deserves equal treatment with minerals and hydrocarbons. The OSS atlas identifies Lake Chad as a basin shared by eight countries, which is enough on its own to make it geopolitically significant in the Sahara and Sahel context.
That fact changes the resource map in two ways.
First, it shifts attention from extraction to survival systems. Water access affects agriculture, pastoral mobility, electricity, settlement stability, and cross-border coordination. Second, it reveals why climate stress and conflict cannot be separated cleanly. In a shared basin, pressure on one part of the system rarely stays local.
Resource strategy in the Sahel isn't only about what's underground. It is about who can secure water, manage mobility, and prevent environmental stress from feeding armed competition.
For policy committees, Lake Chad offers a sharper framework than the old resource curse narrative. The question isn't only whether resources fuel conflict. The question is which kinds of resources, under which territorial conditions, create either cooperation incentives or escalation risks.
Interactive Tools for Further Analysis
Platforms worth using
An effective Africa natural resources map is a working intelligence system, not a static reference. Analysts need tools that let them inspect, compare, and export layers so they can test how deposits interact with corridors, borders, power supply, and basin stress.
The Africa Major Mineral Deposits Web Map remains a strong starting point for mineral screening. The World Bank's framing on resource transformation is useful for a different reason. It shifts attention from what exists underground to what can be processed, moved, and taxed. For hydrology and cross-border environmental pressure, the OSS BRICKS Atlas is still the right reference point when basin structure starts shaping political risk.
Used together, these tools help answer a harder question than "where is the resource?" They help answer whether a resource can be converted into state revenue, export resilience, and bargaining power, or whether it will remain exposed to transport chokepoints, contested jurisdictions, and external dependence. That is the difference between a map used for cataloging and a map used for forecasting.
How to build a usable workflow
The strongest workflow is comparative and sequential. Start with the asset, then test the system around it.
Pin the asset
Identify the mineral belt, oil basin, gas field, or shared water system under review.Trace the corridor
Map the roads, rail lines, river routes, transmission links, and ports that turn a deposit into an export asset.Check political control
Mark borders, subnational jurisdictions, licensing zones, and areas where armed groups, local elites, or weak state presence could interrupt access.Assess conversion capacity
Look for smelters, refineries, grid access, water availability, and industrial sites. If those nodes are missing, much of the value will be captured elsewhere.Define exposure
Write a short risk memo on bottlenecks, foreign partners, fiscal dependence, and the probability that disruption in one node affects the wider chain.
This method produces better judgments because geology rarely determines outcomes on its own. Logistics, processing capacity, and administrative reach often decide whether a resource strengthens the state or deepens vulnerability.
For readers building a wider commodity risk picture, this same method pairs well with broader energy market analysis focused on transport, pricing, and strategic supply exposure.
Analyst's shortcut: If the map does not show the corridor, the processing node, and the governing authority, it does not yet show the full strategic value of the resource.
Strategic Outlook for Africa's Resource Landscape
Africa's resource domain is entering a period where interpretation matters more than ever. The old map of deposits and export categories is no longer enough. Governments and outside powers are now competing over the layers above the geology. Processing, transport, water control, and regulatory reach are where future influence will be built.
That creates a clearer strategic divide. States that connect resources to power systems, transport corridors, and domestic industry will gain room to negotiate. States that remain extraction points without conversion capacity will keep exporting vulnerability along with raw material. The same divide will shape how external actors approach partnerships, finance, and security involvement.
The most useful Africa natural resources map for the next phase is therefore a dashboard, not a poster. It should show deposits, yes, but also rail, ports, basin stress, conflict exposure, and industrial bottlenecks. Analysts who read those layers together will see opportunities earlier and identify instability before it reaches commodity markets or diplomatic crisis channels. Broader energy market analysis works best when it starts from that same premise. Physical geography matters most when it intersects with state capacity and strategic competition.
Vanitiro tracks the intersection of geopolitics, energy, sanctions, conflict, and public life with the kind of concise, source-driven analysis this topic demands. If you want fast context on how infrastructure, chokepoints, diplomacy, and resource competition shape global power, follow Vanitiro.