
A tanker captain receives a warning of suspicious drone activity near the Strait of Hormuz. Within minutes, traders in London, Singapore, and New York start repricing crude, freight, insurance, and political risk before any government issues a formal statement.
That sequence captures the essence of energy market analysis. It isn't a narrow exercise in commodity pricing. It's the actual reading of power, vulnerability, and escalation.
Table of Contents
- Why Energy Market Analysis Is Geopolitical Intelligence
- The Core Engine of Energy Markets
- Reading the Signals Key Indicators and Data Sources
- The Analyst's Toolkit Methods and Models
- When Politics Trumps Production Geopolitical Drivers
- Case Study The Strait of Hormuz and Price Volatility
- From Analysis to Action Forecasting and Policy
Why Energy Market Analysis Is Geopolitical Intelligence
Energy market analysis starts with physical reality. States need fuel, grids need reliability, industries need feedstock, and shipping lanes need security. When any one of those conditions weakens, price becomes the first alarm bell and policy follows behind it.
That matters because the world isn't consuming less energy while it debates transition pathways. In 2024, global primary energy demand reached a record high of 592 exajoules, up 2%, according to the KPMG Statistical Review of World Energy 2025. The strategic implication is plain. More demand means more exposure to disruption, more competition for secure supply, and more room for a local incident to become an international economic problem.
Why prices reveal state vulnerability
A sudden move in oil or gas doesn't just reflect trader emotion. It can reveal that a government may face inflation pressure, a central bank may have less room to maneuver, or an import-dependent economy may be forced into costly emergency decisions.
Energy flows also show where coercive pressure sits. Sanctions, export controls, naval patrols, sabotage risks, refinery outages, and shipping insurance all sit inside the same chain. Analysts who treat energy as a standalone commercial market usually miss the point. The market is also a map of state exposure.
Energy market analysis is most useful when it stops asking, "What is the price?" and starts asking, "Who can move it, who can withstand it, and who can't?"
Why this lens matters now
The old habit was to separate commodity analysis from security analysis. That separation no longer holds. A threat in a maritime chokepoint can alter domestic fuel costs, election-year politics, industrial margins, and alliance behavior in the same cycle.
For readers tracking geopolitical risk coverage, energy isn't a side story to foreign policy. It's one of the clearest transmission mechanisms from distant conflict to domestic consequence.
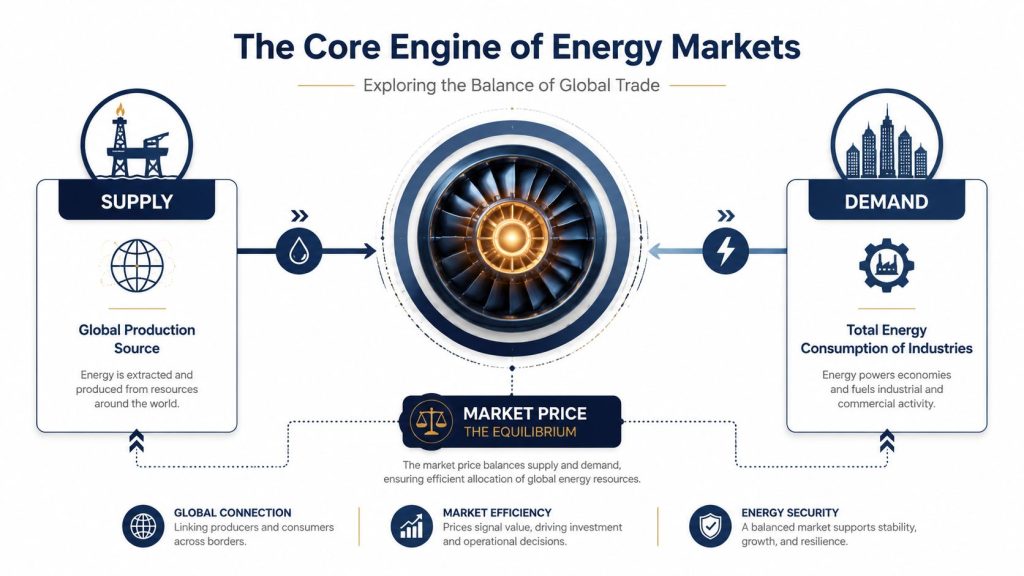
The Core Engine of Energy Markets
Think of the energy system as a global auction that never closes. Producers offer barrels, cargoes, molecules, and electrons. Consumers, utilities, refiners, airlines, factories, and governments keep bidding through their purchasing decisions. Price is the temporary truce between those competing needs.
That auction has two layers. The first is physical trade, where buyers need actual delivery. The second is paper trade, where futures and other contracts express views about what conditions will look like later. Serious energy market analysis has to read both at once.
Spot price versus futures price
The spot market answers a narrow question. What will someone pay for supply available now or very soon?
The futures market answers a harder one. What do participants believe supply, demand, storage, policy, and risk will look like at a later date?
That distinction matters because headlines often confuse today's physical balance with tomorrow's expectation. A market can look well supplied in the present and still rise if traders believe a disruption is approaching. It can also fall during a visible crisis if participants judge that inventories, spare capacity, or weaker demand will absorb the shock.
The balance is fragile even in surplus
Current market structure shows why simple narratives fail. A supply surplus of 1 to 2 million barrels per day persists, with non-OPEC+ producers such as the United States and Brazil adding 1.5 million barrels per day in 2025, according to TalentNeuron's review of oil and energy market data. On paper, that surplus should calm the market.
It doesn't remove fragility. It just changes the threshold for panic.
A balanced reading looks like this:
- Physical supply: More barrels exist than the market immediately needs.
- Transport risk: Those barrels still have to move through ports, pipelines, and sea lanes.
- Policy risk: Sanctions or export restrictions can change usable supply faster than production data suggests.
- Psychological risk: Traders don't wait for confirmed outages if they believe an outage is plausible.
How the auction reacts to new information
Each data point acts like a fresh bid or ask. A refinery outage increases near-term demand for replacement product. A weak industrial signal can lower expected consumption. A military incident near a chokepoint can raise the premium attached to future delivery.
Operational rule: Never read an energy headline in isolation. Ask whether it changes physical availability, transport security, or expectations about both.
That is why energy market analysis isn't just about whether supply exceeds demand. It's about how quickly confidence in that balance can break.
Reading the Signals Key Indicators and Data Sources
Analysts don't get paid for collecting data. They get paid for sorting signal from noise. In energy markets, that means knowing which information describes the physical system, which information captures sentiment, and which information arrives too late to be tradable.
A useful discipline is to divide the dashboard into three buckets: official statistics, market-facing disclosures, and independent observation. None is sufficient alone.
What each source actually tells you
Government releases are usually the baseline for inventories, production, trade, and power demand. They offer structure and comparability. They also lag fast-moving events and may smooth over uncertainty.
Corporate disclosures reveal how operators see costs, hedging, capital allocation, and field conditions. Those disclosures can be candid, but management teams still frame information through investor relations and legal caution.
Private intelligence fills the gap when time matters. Satellite imagery, tanker tracking, shipping data, and field reports can identify movement before formal datasets catch up. These tools are especially useful when official statements are delayed, partial, or politically shaped.
Key Energy Market Data Sources
| Report/Data Source | Issuing Body | Frequency | What It Measures |
|---|---|---|---|
| Inventory reports | Government energy agencies such as the EIA | Regularly scheduled | Stock levels, implied tightness, and short-term balance |
| Production announcements | Producer groups such as OPEC and national ministries | Event-driven and scheduled | Output intentions, quota discipline, and policy signaling |
| Rig count data | Industry service firms such as Baker Hughes | Regularly scheduled | Drilling activity and upstream momentum |
| Tanker tracking and satellite monitoring | Private intelligence providers | Continuous | Cargo movement, port congestion, rerouting, and sanctions evasion patterns |
| Utility and grid disclosures | Grid operators and power market bodies | Regularly scheduled and event-driven | Electricity demand, generation mix, outages, and system stress |
| Company filings and earnings materials | Public energy firms, refiners, shippers | Quarterly and event-driven | Capital plans, hedging posture, operating constraints, and management expectations |
How professionals read the same data differently
The novice asks whether a report is bullish or bearish. The professional asks what the market had already priced in.
That difference is everything. An inventory build may not matter if traders were braced for something worse. A production pledge may not matter if the market doubts compliance. A tanker reroute may matter more than a ministerial statement if it changes actual shipping behavior.
The best indicator is often the one that contradicts the prevailing story. When rhetoric says stability but logistics say stress, trust logistics first.
Good energy market analysis depends on sequence. The question isn’t only what happened. It’s what happened first, who reacted, and which dataset confirmed or disproved the initial narrative.
The Analyst’s Toolkit Methods and Models
No single method can carry an analyst through an energy crisis. Professionals use several lenses because each one answers a different question. One lens explains value. Another explains timing. A third tests whether either view holds up under changing assumptions.

Fundamental analysis
Fundamental analysis asks a physical question. How much energy is being produced, stored, moved, and consumed?
This is the method policymakers often trust first because it maps directly to the actual economy. It looks at supply growth, refinery utilization, weather sensitivity, electricity demand, shipping routes, sanctions exposure, and the behavior of major producers. It is strongest when the market is responding to measurable imbalances.
Its weakness is speed. Fundamentals can tell you whether the market is structurally tight or loose. They are less reliable at telling you the exact moment fear will overpower arithmetic.
Technical analysis
Technical analysis focuses on price action, volume, momentum, and repeatable chart structures. It doesn’t ask whether a producer’s argument is logical. It asks whether market participants are already acting on a view.
That sounds superficial to officials who prefer macro narratives. It isn’t. In a volatile commodity market, charts often show risk appetite before official data catches up.
A concrete example matters here. Backtested models found that breakouts above a 200-day moving average on WTI crude preceded 15% to 25% rallies in 70% of cases during 2022 to 2023, according to CleverMarkets’ review of technical analysis in energy trading. That doesn’t make technical analysis magic. It shows that institutional behavior leaves patterns.
Quantitative analysis
Quantitative models try to formalize relationships that discretionary analysts might describe verbally. They can combine futures curves, shipping data, volatility, weather, currency moves, and policy variables into scenario frameworks.
Their value is discipline. A model forces clarity about assumptions. If an analyst says Hormuz risk matters, a quantitative framework asks how much, through which channel, and under what trigger.
Their weakness is regime change. Models trained on one political environment can fail when deterrence breaks down or when states begin taking actions that historical data treats as outliers.
Why the best analysts blend methods
A resilient workflow usually looks like this:
- Use fundamentals to establish whether the market is physically loose or tight.
- Use technicals to judge whether positioning and momentum support entry, exit, or caution.
- Use quantitative scenarios to stress-test the thesis against disruption, policy error, or transport shock.
Practical rule: Fundamentals tell you what should matter. Technicals tell you what does matter right now. Quant models tell you what could matter next if assumptions fail.
That mix is especially important in politically exposed markets, where prices can detach from near-term balance and trade instead on the probability of escalation.
When Politics Trumps Production Geopolitical Drivers
Production still matters. But in the current environment, politics often decides how much of that production reaches the market, at what cost, and under what risk premium. That is why geopolitical analysis has moved from the margins of energy work to its center.
The most expensive mistakes happen when analysts treat state behavior as background noise. Sanctions can remove usable supply without damaging infrastructure. Naval incidents can disrupt shipping without a formal blockade. Militia attacks can reprice risk without changing a country’s headline production number.

Why chokepoints matter more than spreadsheets admit
A barrel in the ground isn’t equivalent to a barrel delivered. The missing variable is transit. Strait risk, port access, maritime insurance, and naval posture all determine whether nominal supply becomes effective supply.
That is why the Strait of Hormuz sits at the center of strategic energy thinking. It isn’t just a route. It is a pressure point where local confrontation can trigger global repricing.
Integrated geopolitical models found that Iranian proxy attacks correlated with 15% to 20% spikes in Brent crude futures over the past year, while standard energy analyses underweighted that event risk by as much as 30%, as outlined by Energy Action’s assessment of strategic energy market analysis. The lesson is blunt. Traditional models often price calm too generously.
The geopolitical risk premium is real
Analysts use the phrase geopolitical risk premium to describe the extra cost attached to energy because traders fear disruption. That premium isn’t an abstraction. It appears in futures curves, freight rates, hedging costs, insurance pricing, and the speed with which buyers secure replacement cargoes.
Three channels usually drive it:
- Sanctions pressure: Governments restrict payment, shipping, or access to markets.
- Conflict exposure: Missiles, drones, sabotage, or proxy warfare threaten production or transit.
- Strategic signaling: Military deployments and diplomatic breakdowns change expectations before any shot is fired.
For officials tracking Iran, the strategic context matters as much as the commercial one. This assessment of the Iran nuclear threat is relevant not because every diplomatic rupture causes a supply shock, but because each rupture changes how traders price the chance of one.
Markets don’t wait for closure of a chokepoint. They move when credible actors show they can threaten it.
Politics reaches beyond oil
The same logic applies to LNG, critical minerals, grid equipment, and maritime logistics. Energy market analysis that ignores political coercion, alliance structure, and military geography will consistently understate risk. It will also miss opportunity, because markets often reward those who recognize geopolitical change before consensus models update.
Case Study The Strait of Hormuz and Price Volatility
A market can look oversupplied on a balance sheet and still trade like a shortage is imminent. The Strait of Hormuz is where that contradiction becomes visible.
The pattern is familiar. Diplomatic language hardens. Naval assets move. Shipping advisories sharpen. Traders stop asking whether a full disruption is likely and start asking whether they can afford to be wrong if it happens.

How a flashpoint becomes a price event
The first effect is rarely physical shortage. It is repricing of uncertainty.
When U.S.-Iran tensions intensify, the market doesn’t wait for confirmed closure of a sea lane. Tanker operators review routes. Insurers reassess exposure. Importers consider bringing cargoes forward. Futures traders buy protection against a sharp move. Each action adds cost or changes positioning before any major supply loss is recorded.
That is why chokepoint crises override comfortable macro stories. A surplus elsewhere doesn’t matter much if participants suspect that a vital route could become contested with little warning.
For readers following recent Strait of Hormuz developments, the key analytical point isn’t whether each incident becomes a war. It’s that repeated incidents force the market to assign a higher probability to disruption.
Sequence matters more than rhetoric
Analysts should watch the order of events:
- Political rupture: Talks fail, sanctions pressure increases, or deterrent messaging hardens.
- Military signaling: Naval movements, drone sightings, proxy activity, or regional alerts follow.
- Commercial response: Freight, insurance, hedging behavior, and futures positioning adjust.
- Official reassurance: Governments and producers try to calm the market after pricing has already shifted.
Officials often focus on step four because that’s when statements become public and formal. Markets react in step two and step three.
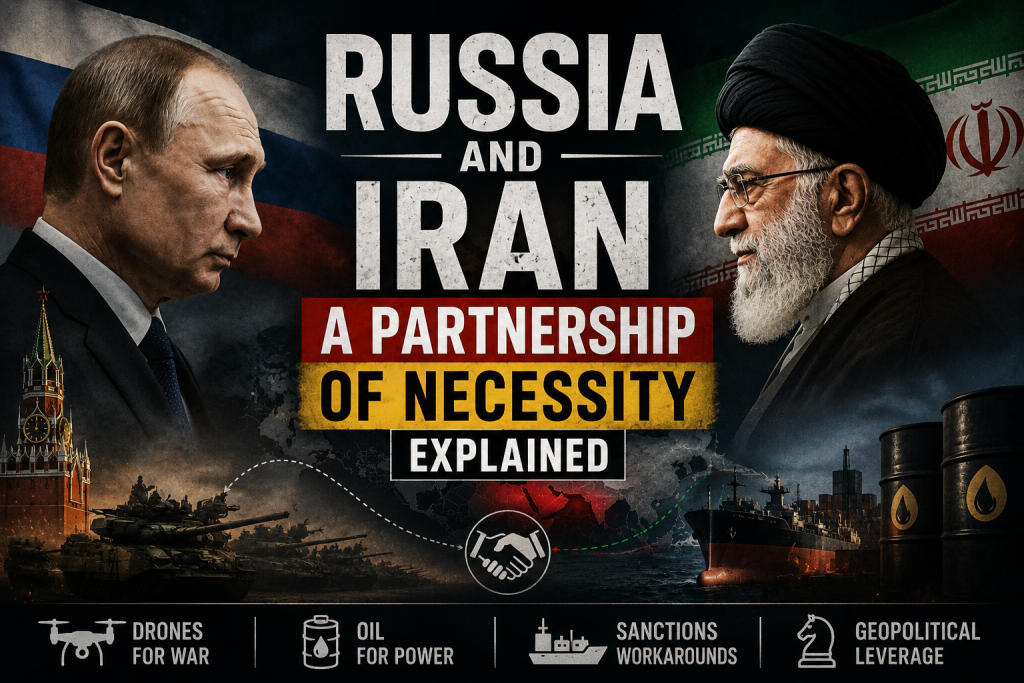
A visual explainer helps clarify how quickly this logic can unfold in practice.
What this case changes in practical analysis
The Strait of Hormuz case forces a harder standard for energy market analysis. You can’t treat geopolitics as a side variable added after the supply-demand model is built. In a chokepoint crisis, geopolitics becomes the model.
The right question in a Hormuz scenario isn’t “Is the market oversupplied?” It’s “How much of that supply remains secure, financeable, and deliverable under stress?”
That distinction separates routine commodity commentary from strategic analysis. It also explains why official calm can coexist with market anxiety. Governments may want to prevent panic. Traders have to price it.
From Analysis to Action Forecasting and Policy
The practical value of energy market analysis lies in decision quality under pressure. Governments use it to test sanctions strategy, reserve planning, maritime posture, and inflation exposure. Companies use it to hedge procurement, sequence investment, and reduce transport vulnerability. Financial actors use it to manage timing and tail risk.
The strongest approach isn’t a single forecast. It’s a set of disciplined scenarios tied to clear triggers. Analysts should define what changes their view, what confirms escalation, and what would prove the thesis wrong. That matters more than publishing a confident headline number.
What decision-makers should prioritize
A geopolitically serious framework should include:
- Scenario design: Build cases for base conditions, disruption, and de-escalation rather than betting on one path.
- Trigger monitoring: Watch sanctions moves, shipping behavior, military signaling, and futures structure together.
- Cross-market effects: Test how oil, gas, power, freight, and insurance interact instead of studying each in isolation.
- Revision discipline: Update assumptions quickly when logistics contradict political messaging.
The long horizon is changing too
Short-term shocks dominate headlines, but the strategic backdrop is shifting in another direction as well. Electricity demand, driven by data centers and electrification, is projected to grow at twice the rate of total energy demand, with renewables such as solar and wind positioned to meet that growth by 2050, according to Resources for the Future’s Global Energy Outlook 2025. That means officials and investors have to manage two realities at once.
First, hydrocarbons remain exposed to geopolitical disruption in the present. Second, power systems, grids, and electricity supply chains are becoming more strategically important over time. The future energy map won’t be less political. It will be political in more places.
The final strategic lesson
Perfect prediction isn’t available. Surprise is built into the system. But surprise isn’t the same as randomness.
Good energy market analysis identifies where the system is fragile, which actors can exploit that fragility, and how fast local confrontation can become a national economic issue. In the current environment, the most costly blind spot isn’t missing a production statistic. It’s underestimating geopolitical risk until the market has already priced it.
Vanitiro tracks the link between conflict, sanctions, maritime risk, and everyday economic consequences with speed and discipline. If you need concise, source-based coverage of Middle East flashpoints and their impact on energy and politics, follow Vanitiro.